Website downtime can turn a normal business day into an expensive incident. A website may stop loading because a server fails, a DNS record changes, an SSL certificate expires, a software update breaks an application, or a traffic spike overwhelms available resources. In many cases, the technical failure itself is only part of the problem. The bigger issue is how long the business takes to discover and respond to it.
For an online business, even a short outage can interrupt sales, prevent customers from accessing services, disrupt lead generation, and damage trust. For agencies and IT teams managing multiple websites, manually checking every website is not a practical way to detect problems.
This is where automated website uptime monitoring becomes important. Instead of waiting for a customer to report that a website is unavailable, monitoring systems can continuously test critical endpoints and alert the responsible team when something goes wrong.
In this guide, we will examine what causes website downtime, how different failures affect availability, why manual detection is unreliable, and how businesses can detect website outages faster through automated monitoring and a structured incident response process.
What Is Website Downtime?
Website downtime occurs when users cannot successfully access or use a website or one of its critical services.
The simplest example is an HTTP request that receives no response because the server is unavailable. However, downtime does not always mean that the entire server has stopped working.
A website can technically have a running server while users still experience an outage.
For example:
- DNS may point visitors to the wrong IP address.
- An SSL certificate may have expired.
- A web server may return HTTP 500 errors.
- A database may become unavailable.
- A firewall may block legitimate traffic.
- An application may crash while the operating system remains online.
- A server may respond so slowly that users effectively cannot use the website.
- A deployment may introduce an application error.
This distinction matters because a simple “server is online” check cannot detect every type of website failure.
Effective monitoring therefore needs to look beyond basic server availability.
What Causes Website Downtime?
There is rarely one universal cause of website downtime. Most outages fall into several broad categories involving infrastructure, applications, networks, DNS, security, configuration, or human actions.
Understanding these causes makes it easier to design an effective monitoring strategy.
1. Server and Hosting Infrastructure Failures
One of the most obvious causes of downtime is a problem with the infrastructure hosting the website.
A physical server, virtual machine, storage system, network interface, or hosting platform can experience an outage.
Common infrastructure problems include:
- Hardware failure
- Disk or storage failure
- Network interruption
- Power problems
- Hypervisor failures
- Server crashes
- Operating system failures
- Resource exhaustion
- Data center incidents
- Unplanned maintenance
A server may also remain technically online while running out of CPU, RAM, disk space, or other resources.
For example, consider a WordPress website experiencing a sudden increase in traffic. If available memory becomes exhausted, PHP workers may fail or database connections may become unavailable. The server itself may still respond to basic network requests, but the website can return errors to visitors.
This is why uptime monitoring should test the actual website rather than only checking whether a server responds to a ping.
For businesses choosing infrastructure, the underlying hosting environment also matters. Infrastructure reliability, server resources, software configuration, and geographic location can all influence how resilient a website is during unexpected traffic or infrastructure problems. Businesses evaluating hosting options can explore Limitless Hosting for additional hosting information.
2. DNS Failures and Incorrect DNS Records
The Domain Name System, or DNS, connects a domain name with the infrastructure that serves it.
When someone enters:
https://example.com
their device needs to resolve the domain to the appropriate IP address before establishing a connection with the website.
A DNS problem can therefore make a perfectly healthy server appear offline.
Common DNS-related causes of downtime include:
- Incorrect A or AAAA records
- Deleted DNS records
- Incorrect nameservers
- Expired DNS services
- Incorrect CNAME configuration
- DNS propagation problems
- Misconfigured DNS security settings
- Accidental changes by administrators
- Registrar-related configuration issues
A particularly dangerous scenario occurs when someone changes a DNS record without realizing that it affects production traffic.
DNS monitoring can help identify unexpected changes before they develop into prolonged availability problems. For organizations managing important domains, monitoring DNS behavior should be part of a broader infrastructure monitoring strategy.
3. Expired or Invalid SSL Certificates
SSL/TLS certificates protect encrypted connections between browsers and websites.
When a certificate expires, browsers can display security warnings or prevent users from accessing the website normally.
An expired certificate can therefore cause a website to become effectively unavailable even when:
- The server is running.
- DNS is working.
- The website application is healthy.
- The database is functioning.
- The network is operational.
This is one reason certificate expiration should not be treated as a minor administrative issue.
Businesses with multiple domains and subdomains can easily lose track of certificate expiration dates when relying on spreadsheets or calendars.
Automated certificate monitoring can continuously inspect certificate validity and provide advance warnings before expiration.
For organizations that depend heavily on HTTPS, monitoring should also consider certificate changes, certificate chains, hostname mismatches, and TLS connection problems.
4. Application and Software Errors
Not every outage starts with infrastructure.
Sometimes the underlying server works correctly while the website application fails.
A software deployment, plugin update, framework change, configuration modification, or application bug can cause unexpected errors.
Typical symptoms include:
HTTP 500 Internal Server Error
HTTP 502 Bad Gateway
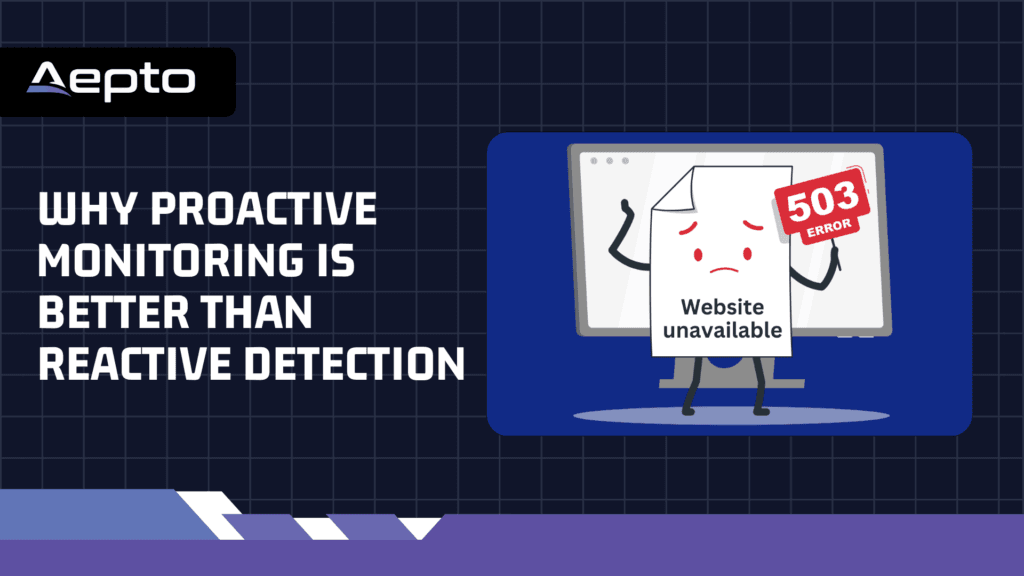
HTTP 503 Service Unavailable
HTTP 504 Gateway Timeout
These status codes can provide useful clues about where an incident is occurring.
For example:
| Status Code | Typical Meaning |
|---|---|
| 500 | Internal application/server error |
| 502 | Invalid response from an upstream server |
| 503 | Service temporarily unavailable |
| 504 | Upstream service failed to respond in time |
The exact root cause requires investigation, but monitoring the HTTP response provides an important first signal.
This is particularly useful after deployments. If a new release causes the application to return errors, an automated monitor can identify the change shortly after deployment instead of waiting for customers to report it.
Take the Work Out of Domain Monitoring
Monitor your domains with Aepto’s AI-powered system and spend less time checking websites, ownership changes, expirations, and other important domain activity manually.
5. Database Failures
Many modern websites depend on databases for authentication, products, content, transactions, customer records, and other application data.
If the database becomes unavailable, the website may stop functioning even though the web server itself remains online.
Database-related downtime can result from:
- Database crashes
- Connection limits
- Corrupted data
- Authentication failures
- Network connectivity issues
- Resource exhaustion
- Failed migrations
- Configuration errors
- Storage problems
A website may sometimes load its static components while failing when users perform database-dependent actions.
For example, a homepage might load while checkout, login, account pages, or search functionality fails.
This demonstrates why availability monitoring should focus on important user journeys and application endpoints rather than relying exclusively on a single homepage check.
6. Traffic Spikes and Resource Exhaustion
A sudden increase in traffic can be good news for a business—until the infrastructure cannot handle it.
Traffic spikes can occur because of:
- Viral content
- Marketing campaigns
- Product launches
- Seasonal demand
- News coverage
- Successful advertising
- Bot traffic
- DDoS attacks
When traffic exceeds available resources, websites may become slow or completely unavailable.
Common symptoms include:
- Increasing response times
- HTTP 503 errors
- Database connection failures
- CPU saturation
- Memory exhaustion
- Increased queue times
- Connection timeouts
Monitoring response time alongside availability can help businesses detect degradation before it becomes a complete outage.
7. Human Configuration Errors
People remain one of the most common sources of infrastructure problems.
An administrator may accidentally:
- Delete a DNS record.
- Change a firewall rule.
- Modify a web server configuration.
- Remove a required application file.
- Deploy the wrong configuration.
- Disable a service.
- Change database credentials.
- Forget to renew a certificate.
- Point a domain toward the wrong server.
These mistakes are particularly difficult to prevent in environments where multiple people manage the same infrastructure.
A strong monitoring system provides an independent layer of detection.
Even if a configuration change happens accidentally, monitoring can identify the resulting service impact.
8. Cybersecurity Incidents
Security incidents can also create website downtime.
An attack may overload infrastructure, modify configuration, disrupt DNS, compromise an application, or force administrators to take systems offline during containment.
Examples include:
- Distributed denial-of-service attacks
- Web application attacks
- Malware infections
- Account compromise
- Unauthorized DNS changes
- Credential theft
- Infrastructure intrusion
Availability monitoring does not replace security monitoring. Instead, the two complement each other.
A security system may identify suspicious activity while an uptime monitor confirms whether customers can still access the affected service.
Why Manual Website Checks Are Not Enough
A common approach to website monitoring is simple:
“I check the website every morning.”
That may work for a personal project, but it does not provide reliable availability monitoring for a business.
An outage can happen at any time.
If a website goes offline at 2:00 AM and the team checks it at 9:00 AM, the business has already experienced seven hours of undetected downtime.
Manual checks also become increasingly difficult as the number of websites grows.
Imagine an agency managing 50 client websites.
Checking every website manually several times a day would consume significant time, and humans can still miss an outage between checks.
Automated monitoring solves this by continuously checking websites according to a defined schedule.
How Does Website Uptime Monitoring Work?
A typical uptime monitoring system repeatedly sends requests to a website or service and evaluates the response.
A simplified process looks like this:
Monitoring System
       |
       v
Send Request
       |
       v
DNS Resolution
       |
       v
TCP/TLS Connection
       |
       v
HTTP Request
       |
       v
Evaluate Response
       |
       +---- Healthy ----> Record Result
       |
       +---- Failure -----> Trigger Alert
Depending on the monitoring system, the check may evaluate:
- DNS resolution
- Connection success
- TLS certificate validity
- HTTP status code
- Response time
- Content availability
- Endpoint behavior
The system then records the result and compares it with expected behavior.
If the service fails repeatedly, it can trigger an alert.
How to Detect Website Downtime Faster
Detecting downtime quickly requires more than installing a monitoring tool. Businesses should design monitoring around the services that matter most.
1. Monitor the Actual Website
Start with the public-facing website.
A basic HTTP or HTTPS check can confirm whether the site responds successfully.
The monitor should generally track:
- HTTP status
- Response time
- Connection availability
- HTTPS availability
- Certificate validity
Monitoring the actual URL provides a more useful signal than simply checking whether the hosting server responds.
2. Monitor Critical Pages and Endpoints
A homepage can be available while an important business function is broken.
For example:
- Login may fail.
- Checkout may fail.
- API requests may fail.
- Contact forms may stop working.
- Payment pages may return errors.
Identify the URLs that directly support revenue or customer activity and monitor them separately. This creates a more realistic picture of application availability.
3. Monitor DNS Changes
DNS is a critical dependency for website availability. Unexpected DNS changes can redirect traffic, break resolution, or expose organizations to security problems. Businesses managing multiple domains should monitor important DNS records and investigate unexpected changes.
This becomes especially valuable when multiple employees, agencies, registrars, or infrastructure providers have access to domain configuration.
4. Monitor SSL Certificates Before They Expire
Do not wait for an SSL certificate to fail before discovering the problem. Set monitoring to provide warnings well before expiration.
A useful alerting strategy might provide notifications:
- Several weeks before expiration
- One week before expiration
- A few days before expiration
- Immediately if the certificate becomes invalid
This gives administrators time to renew and deploy replacement certificates.
5. Use Multiple Monitoring Locations
A website may appear unavailable from one network while remaining accessible from another. Possible causes include:
- Routing problems
- Regional DNS issues
- Firewall rules
- CDN problems
- ISP failures
- Geographic restrictions
Monitoring from multiple locations can help distinguish a global outage from a regional connectivity issue. This is particularly important for businesses serving customers across different countries.
6. Configure Alerts for the Right People
An alert is only useful if it reaches someone who can respond. Depending on the organization, notifications may be sent through:
- Messaging platforms
- Webhooks
- Incident management systems
- Other automated integrations
For automated workflows, Aepto alert webhooks can connect monitoring events with external systems. The goal is to reduce the time between:
Failure → Detection → Notification → Investigation → Recovery
7. Reduce False Positives
Fast detection does not mean sending an alert every time a single request fails. Temporary network problems can create false positives. A better monitoring strategy can use multiple checks or consecutive failures before declaring an outage.
For example:
Check #1 → Failed
Check #2 → Failed
Check #3 → Failed
             ↓
        Confirm outage
             ↓
           Alert
This approach helps balance detection speed with alert reliability.
8. Monitor Response Time, Not Just Availability
A website does not need to be completely offline to cause problems. Suppose the website responds successfully but takes 15 seconds to load an important endpoint. Technically, the service is “up.”
Operationally, users may still consider it unusable. Monitoring response time can therefore reveal performance degradation before it becomes a complete outage. Tracking latency over time also helps teams identify trends.
If response times gradually increase from 500 milliseconds to 1 second, then 2 seconds, that may indicate an emerging infrastructure or application problem.
What Should You Do When a Website Goes Down?
The fastest response starts with identifying where the failure occurs. Use a simple troubleshooting sequence.
Step 1: Confirm the Outage
First determine whether the website is actually unavailable. You can use command-line tools such as:
curl -I https://example.comA successful response may look like:
HTTP/2 200An error might look like:
HTTP/2 503For DNS troubleshooting:
dig example.comor:
nslookup example.comThese commands can help determine whether the problem involves DNS resolution or HTTP availability.
Step 2: Check DNS
Verify that the domain resolves to the expected infrastructure.
Look for:
- Incorrect IP addresses
- Missing records
- Unexpected nameservers
- Recent DNS changes
Step 3: Check the Server
If DNS looks correct, investigate the hosting environment.
Check:
- CPU usage
- Memory
- Disk space
- Network connectivity
- Running services
- Recent system changes
Step 4: Check Application Logs
If the server is healthy but the website returns errors, inspect application and web server logs. For example:
tail -f /var/log/nginx/error.log
The exact log location depends on your server and software stack.
Step 5: Check Recent Changes
Ask: What changed immediately before the outage?
Review:
- Deployments
- Plugin updates
- DNS changes
- Firewall modifications
- SSL renewals
- Server migrations
- Configuration changes
This can significantly reduce troubleshooting time.
How Monitoring Reduces Mean Time to Detect
One of the most important operational metrics during an outage is Mean Time to Detect (MTTD). MTTD measures how long it takes an organization to discover that a problem has occurred. Consider two scenarios.
Without automated monitoring
Website fails
     ↓
No alert
     ↓
Customer notices
     ↓
Customer contacts business
     ↓
Team investigates
The detection time could be hours.
With automated monitoring
Website fails
     ↓
Automated check detects failure
     ↓
Alert sent
     ↓
Team investigates
Detection can happen much closer to the moment the failure occurs. Reducing MTTD does not necessarily prevent outages, but it can reduce the amount of time a business remains unaware of an incident.
Centralize Monitoring for Multiple Websites
Businesses and agencies often manage more than one digital property.
An organization may have:
- Main corporate website
- E-commerce website
- Customer portal
- Blog
- Marketing landing pages
- APIs
- Client websites
- Regional websites
- Multiple domains
Managing these independently can make monitoring fragmented. A centralized monitoring platform allows teams to see important events in one place. Aepto’s smart global uptime monitoring is designed around continuous website availability monitoring, helping teams track website status and respond to availability issues more efficiently.
Centralization also makes it easier to establish consistent monitoring policies across multiple properties.
Website Downtime Monitoring Checklist
Businesses can use the following checklist when designing their monitoring strategy:
| Monitoring Area | What to Check |
|---|---|
| Website availability | HTTP/HTTPS response |
| HTTP status | 2xx, 3xx, 4xx, and 5xx responses |
| Response time | Increasing latency or slow endpoints |
| DNS | Resolution and record changes |
| SSL/TLS | Certificate validity and expiration |
| Infrastructure | Server and network availability |
| Critical endpoints | Login, API, checkout, forms |
| Alerts | Delivery to responsible teams |
| Geographic availability | Regional accessibility |
| Incident response | Investigation and recovery workflow |
A monitoring strategy becomes much more effective when these checks work together rather than operating as isolated systems.
Why Proactive Monitoring Is Better Than Reactive Detection
Reactive detection starts after someone notices a problem.
That person could be:
- A customer
- An employee
- A sales representative
- A support agent
- A website administrator
The problem is that these people are not dedicated monitoring systems.
Proactive monitoring continuously checks infrastructure and provides an independent signal when expected behavior changes. This is particularly important for revenue-generating websites.
If customers are the first people to discover an outage, the business has already lost valuable time.
Build a Monitoring Strategy Around Business Impact
Not every website needs the same monitoring configuration. A personal blog may only require basic uptime checks. An e-commerce platform may need much more comprehensive monitoring. Consider assigning monitoring priorities based on business impact.
Critical
Examples:
- E-commerce checkout
- Customer portal
- Payment-related endpoints
- Production APIs
These should have aggressive monitoring and immediate alerts.
Important
Examples:
- Main corporate website
- Lead-generation forms
- Marketing websites
These should receive continuous monitoring and timely notifications.
Lower Priority
Examples:
- Development websites
- Archived projects
- Internal test environments
These may require less frequent checks.
This approach helps teams focus their response efforts where downtime has the greatest operational impact.
The Difference Between Detecting Downtime and Preventing It
Monitoring does not magically prevent every outage.
Its primary function is detection.
However, monitoring data can contribute to prevention by revealing recurring problems.
For example, monitoring might show:
Monday: 1.2s average response
Tuesday: 1.8s
Wednesday: 2.5s
Thursday: 4.1s
Friday: Timeout
The final outage may have been preceded by measurable performance degradation.
Without historical monitoring data, the team might only see the final failure.
With monitoring data, engineers can investigate the trend and potentially address the underlying capacity, application, or infrastructure problem earlier.
Conclusion
Website downtime can result from many different problems, including server failures, DNS mistakes, expired SSL certificates, application errors, database outages, traffic spikes, configuration mistakes, and security incidents.
The challenge is not simply understanding what causes website downtime. Businesses also need to detect failures quickly enough to reduce their operational impact.
Manual website checks are not reliable for modern businesses managing important online services. Automated uptime monitoring provides continuous visibility into website availability, response times, DNS behavior, SSL status, and critical endpoints.
A practical monitoring services, like Aepto, should:
- Monitor actual websites instead of relying only on server checks.
- Track critical pages and application endpoints.
- Monitor DNS and SSL dependencies.
- Measure response time as well as availability.
- Use multiple monitoring locations where appropriate.
- Send alerts to the right people.
- Reduce false positives through reliable failure confirmation.
- Centralize monitoring when managing multiple websites.
- Use monitoring history to identify recurring problems and performance degradation.
With proactive monitoring in place, teams can move from finding out about outages through customer complaints to receiving actionable alerts when a service starts failing.
For businesses that depend on their websites for sales, leads, communication, or customer services, that difference can be significant.
Frequently Asked Questions
1. What is the most common cause of website downtime?
Website downtime can have many causes, including server failures, software errors, DNS misconfiguration, resource exhaustion, expired SSL certificates, database problems, network failures, and human configuration mistakes. The actual cause depends on the infrastructure and application involved.
2. How can I detect website downtime quickly?
Automated uptime monitoring is one of the most effective ways to detect website downtime quickly. A monitoring system can repeatedly test your website and alert your team when it detects failed requests, unexpected HTTP responses, excessive response times, or other availability problems.
3. Can DNS problems cause website downtime?
Yes. A website can become inaccessible when DNS records are incorrect, deleted, misconfigured, or unexpectedly changed. The hosting server may remain completely operational while visitors cannot correctly resolve the domain.
4. Can an expired SSL certificate cause downtime?
Yes. An expired or invalid SSL/TLS certificate can cause browsers to display security warnings or prevent normal access to a website. Automated SSL monitoring can provide advance warnings so administrators have time to renew certificates.
5. Should I monitor website response time as well as uptime?
Yes. A website can technically be available while responding so slowly that users struggle to use it. Monitoring response time helps identify performance degradation and can reveal potential infrastructure or application problems before they become complete outages.
6. How often should a website be checked for downtime?
The appropriate monitoring frequency depends on how critical the website is. Revenue-generating and mission-critical services generally benefit from frequent automated checks, while lower-priority websites may require less frequent monitoring. The important point is to monitor continuously rather than rely on occasional manual checks.
7. Can website monitoring help prevent downtime?
Monitoring primarily detects and reports problems rather than directly preventing them. However, historical uptime, latency, DNS, and availability data can reveal recurring failures and performance trends, allowing technical teams to identify and address underlying problems before they cause larger incidents.
Latest post: