In the hyper-scale digital economy, your online infrastructure is the primary engine of your company’s growth, customer engagement, and transaction processing. Every consumer-facing application, e-commerce storefront, corporate website, and dynamic application programming interface (API) is expected to be accessible instantly, around the clock. In a globalized marketplace that never sleeps, continuous digital availability is no longer a luxury—it is a baseline requirement for corporate survival.
What Is Uptime Monitoring? When a digital asset experiences unexpected downtime, the consequences are immediate, transparent, and financially devastating. Transactions freeze. Customer-facing services crash. Corporate emails bounce. Search engine crawlers hit dead-ends, causing technical search engine optimization (SEO) rankings to decline in a matter of days. More critically, digital trust evaporates, and your brand’s reputation suffers visible public damage as customers turn to competitors who remain online.
Despite these severe risks, many organizations monitor their live services using outdated, reactive techniques. They rely on manual checks, periodic internal audits, or worse, wait for frustrated users to report a broken link on social media.
To break free from this vulnerable, high-risk posture, modern enterprises implement automated uptime monitoring. This comprehensive guide explores the technical architecture of uptime monitoring, how it functions under the hood, the different monitoring styles required to secure modern runtimes, and how pairing uptime intelligence with robust hosting infrastructures builds an impenetrable shield around your digital presence.
Key Takeaways
Before examining the technical layers of continuous availability, here is an executive summary of modern uptime monitoring:
- More Than a Ping: True uptime monitoring goes beyond simple network reachability, evaluating application behaviors, SSL certificate lifespans, and page content integrity.
- The Latency Trap: A website can return an “OK” status code but load so slowly that users bounce. “Slow” is the new “down.”
- Multi-Regional Verification: External monitoring engines must query your assets from multiple global locations to eliminate false positives and catch localized routing issues.
- Deep Content Inspections: Automated crawlers must inspect actual on-page HTML elements to detect subtle web shell injections and visual brand defacements.
- Agile Notification Workflows: Pair real-time event triggers with webhooks to push critical incidents straight into active chat workspaces and automation systems.
- Complete Defensive Perimeters: Align server-side hardware monitoring with registry-level domain watching to secure your brand from the DNS root to the physical drive.
What is Uptime Monitoring?
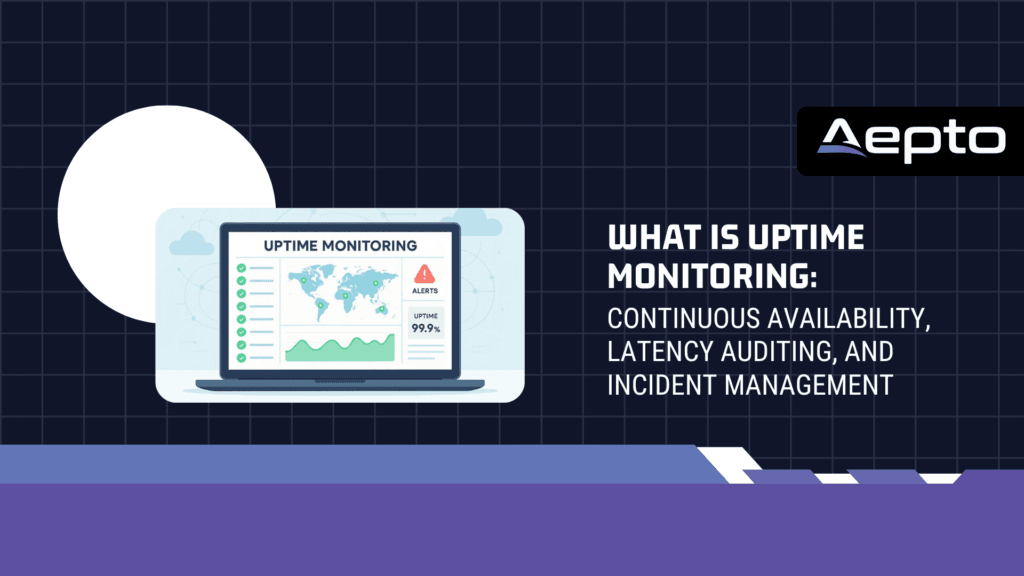
At its core, uptime monitoring is an automated, continuous testing methodology used to verify that a target website, API endpoint, server port, or network resource is active, responsive, and functioning correctly for global users.
Unlike local server agents that run inside your virtual private clouds, professional uptime monitoring operates externally. It uses a distributed network of remote testing servers (known as monitoring nodes) located in geographic datacenters around the world. These nodes periodically send simulated client requests to your target asset, measuring the response characteristics to evaluate its overall operational health.
THE REAL-TIME MONITORING CYCLE:
[ Geo-Distributed Nodes ] ➔ [ Simulated User Request ] ➔ [ Analyze Response Code & Speed ] ➔ [ Multi-Channel Alert if Failed ]
By querying your resources at regular, high-frequency intervals (such as every 30 or 60 seconds), uptime monitors act as digital watchdogs, identifying performance anomalies and service drop-offs the exact millisecond they occur.
The Multi-Layered Anatomy of Digital Availability
A common operational mistake is treating website uptime as a single, binary metric. In reality, a modern digital service is composed of several interdependent technical layers. To ensure comprehensive coverage, uptime monitoring software must analyze each level of your connection stack:
The Network Layer (ICMP/Ping)
The most basic form of monitoring utilizes the Internet Control Message Protocol (ICMP) to send “ping” requests to your server’s IP address. If the server is physically online and connected to the network, it sends an echo reply. While useful for verifying bare-metal hardware connectivity, network-level pings are blind to application failures; your physical server may be online, but if your database engine has crashed, your users will still experience total downtime.
The Protocol and Transport Layer (TCP Port Monitoring)
To verify that specific server-side daemons are listening for connections, uptime monitors perform TCP port audits. The system attempts to open connection handshakes on dedicated service ports:
- Port 80/443: Web servers (HTTP/HTTPS)
- Port 21: File Transfer Protocol (FTP)
- Port 25/110/143/587: Mail services (SMTP, POP3, IMAP)
- Port 3306: Relational Databases (MySQL/MariaDB)
If a port handshake fails, the monitoring engine knows that specific service has crashed, even if the primary server operating system remains online.
The Application and Content Layer (HTTP/HTTPS GET)
This is the most critical monitoring layer for corporate websites. The monitoring engine executes standard HTTP/HTTPS GET or POST requests to your specific URLs, acting exactly like a real human browser. It analyzes the return payload to verify two core metrics:
- The HTTP Status Code: The server must return a successful code (such as
200 OKor redirects like301/302). If the server returns an error status (such as500 Internal Server Error,502 Bad Gateway, or503 Service Unavailable), the monitor immediately flags a failure. - Response Time (Latency): The monitor tracks how many milliseconds elapse between sending the initial request and receiving the final byte of data.
Why Standard Status Codes Lie: The Need for Content Integrity
One of the most dangerous blind spots in basic web infrastructure management is assuming that a successful HTTP 200 OK code means your website is working. This metric can be highly deceptive.
Consider these common corporate disaster scenarios:
- The “White Screen of Death”: A database timeout or memory-allocation failure inside your Content Management System (CMS) causes your server to render a completely blank white page. Because the PHP execution technically completed without a fatal core failure, the server returns an HTTP
200 OKstatus, leaving basic monitoring tools completely unaware that your visitors are seeing a blank screen. - Malicious Code Injection: Attackers compromise your website’s files (e.g., via a weak administrative password or unpatched plugin) and inject a visual defacement page, malware redirects, or credit-card scraping scripts. To standard diagnostic bots, the page loads fine and returns code 200, while your actual customer experience is completely hijacked.
To protect your business from these invisible exploits, organizations must implement advanced content-auditing layers.
By utilizing Aepto’s professional ai-driven website content monitoring systems, you can configure your monitors to execute deep keyword, string, or visual checks. Instead of just reading headers, the engine parses the actual on-page HTML files to verify that specific baseline elements—such as your brand name, core product text, or structural footers—are present.
If these expected strings are missing, or if unauthorized modifications to your page metadata are detected, the system triggers a high-priority warning, exposing subtle script injections and content anomalies that standard uptime bots miss.
The Critical Role of Global, Multi-Regional Verification
A website is never truly “up” or “down” globally. Due to the complex routing networks of the global internet, users in Chicago may load your site instantly, while users in Singapore experience total timeout failures due to localized routing bottlenecks, physical submarine fiber-optic breaks, or regional Domain Name System (DNS) propagation drifts.
If your monitoring software only checks your website from a single server located in your local region, you face two critical operational liabilities:
The False-Alarm Nightmare
If your single monitor node encounters a localized datacenter power drop, a DNS glitch, or an internet exchange bottleneck, it will report that your website is down. Your IT team will be woken up by emergency alarms at 3:00 AM, only to find that your web server is running flawlessly. This alert fatigue quickly causes real, critical warnings to be ignored.
Geographic Blind Spots
Conversely, if your server experiences a major routing failure in Europe, but your single monitor is located in the United States, your dashboard will show a healthy green status while thousands of European customers are encountering dead pages.
To resolve these technical gaps, modern web operations rely on global monitoring systems.
By deploying Aepto’s integrated smart global uptime monitoring networks, you run parallel tests across geographic clusters spanning the Americas, Europe, and Asia-Pacific.
THE CONCURRENCY VERIFICATION LOOP:
[ Node A: USA - OK ] ➔ [ Node B: Europe - FAILED ] ➔ [ Trigger Diagnostic Peer Check ]
       ➔ [ Node C: Singapore - FAILED ] ➔ [ Real-time Incident Confirmed ]
When a monitoring node detects an anomaly, the platform does not trigger an alarm instantly. Instead, it initiates a real-time peer-check, routing test requests from adjacent regional nodes to confirm the failure. If multiple global nodes confirm the outage, the platform verifies the critical incident, eliminating false positives and mapping localized routing issues instantly.
Security Integration: Connecting Web Speed to Hardened Hosting
Building an agile, continuous digital brand requires a unified defense-in-depth approach. While setting up real-time uptime monitors, domain watches, and content verifications secures your external brand routing, your live site databases and actual application files must be stored on highly secure, performant web servers.
A highly secure domain routing path or rapid monitoring system is only as resilient as the backend hardware it points to. Pointing your secure configurations to an enterprise-grade hosting provider like Limitless Hosting provides the ultimate defense-in-depth model.
When your hosting infrastructure is fast, secure, and actively hardened against localized server exploits, your web applications can run smoothly without performance bottlenecks. This synergy ensures that any discrepancy—whether it is an external DNS spoofing attempt or a server-side resource spike—is detected and neutralized instantly, ensuring your global audience always finds an authentic, high-speed website.
By aligning your uptime intelligence with highly optimized hosting environments, you eliminate technical gaps. If your hosting environment encounters a sudden localized node issue, or if your domain DNS is modified by an unauthorized third party, the unified tracking allows your engineering team to detect the failure point in seconds and restore operations immediately.
Incident Response Management: Turning Alerts into Action
Detecting a website outage is only half of the battle; you must also possess the technical infrastructure to coordinate rapid mitigations. When a critical database node goes dark, or an unauthorized DNS modification occurs, every minute of delay increases your financial recovery costs.
Historically, organizations relied on passive, manual email notifications to alert their system administrators. However, email is an incredibly fragile mechanism for active incident response. Urgent warnings are easily buried in cluttered inboxes or delayed by mail server greylists.
To maintain continuous availability, scaling enterprise teams utilize active ChatOps and webhook integrations to automate their incident response playbooks.
Continuous Workspace Delivery
By utilizing Aepto’s professional alert webhooks integration, you can route automated alerts directly to your team’s favorite workspace portals, such as Slack, Microsoft Teams, or Discord. The moment an active monitoring node detects a failure, the system bypasses passive mail servers. It immediately pushes a rich, structured alert card to your designated channel. This card displays:
- The exact domain or API path affected.
- The specific error type or failed HTTP status code.
- The precise global location confirming the failure.
- A direct troubleshooting link, allowing your on-call engineers to coordinate mitigations instantly.
Automating Infrastructure Self-Healing
Because webhooks transmit structured JSON payloads, you do not have to limit notifications to chat apps. You can point your webhook URLs to custom APIs on your own servers, serverless cloud functions, or API-driven system administrators.
When an outage is verified, your serverless script can read the incoming payload and trigger automated self-healing commands—such as rebooting an un-isolated VPS, flushing localized page caches, or automatically opening a high-priority ticket in systems like Jira, ensuring your technical response is completely structured and automated.
Strategic Public Communication: Reclaiming Trust via Status Pages
No matter how robust your hosting is or how fast your developers respond, digital systems will occasionally encounter outages. When an unexpected blip occurs, how you communicate with your audience dictates your long-term brand equity.
If your services go offline and you attempt to obscure the issue, your customer support desk will be flooded with repetitive help tickets, and user frustration will spike on social media. Transparency is the ultimate engine of online goodwill.
THE TRANSPARENT INCIDENT LIFECYCLE:
[ Outage Occurs ] ➔ [ Automated Public Status Page Update ] ➔ [ Customers Informed ] ➔ [ Support Tickets Deflected ] ➔ [ Service Restored ]
To streamline this communication boundary, modern web professionals utilize public status pages. These public portals act as independent status boards, cleanly showing the active health of your services (such as “API,” “Checkout,” or “Main Site”).
By directing your users to a beautifully customized, independent status page, you can:
- Display Real-Time Metrics: Share historical uptime charts and latency graphs to prove long-term reliability.
- Announce Planned Maintenance: Post clear, upcoming scheduled downtime banners, preventing support panics before maintenance even starts.
- Consolidate Support Channels: Embed a live support widget or centralize communication channels directly on the status page to keep users updated in real time.
Slicing Your Availability Risk: Multi-Domain Surveillance
Uptime monitoring must extend beyond simply querying active URLs. For scaling digital brands and multi-site agencies, true digital safety requires tracking the technical lifecycles, registrars, and DNS zones of your entire domain inventory.
If you own defensive variations, regional ccTLDs, or aftermarket domains, leaving them unmanaged is a significant risk. If a domain’s auto-renewal fails due to an expired billing card, or if an attacker hijacks a secondary domain registrar account, they can easily exploit the asset, causing silent brand damage that your server-side firewalls are completely blind to.
To secure this boundary, enterprise-grade operations must combine application monitors with active domain surveillance.
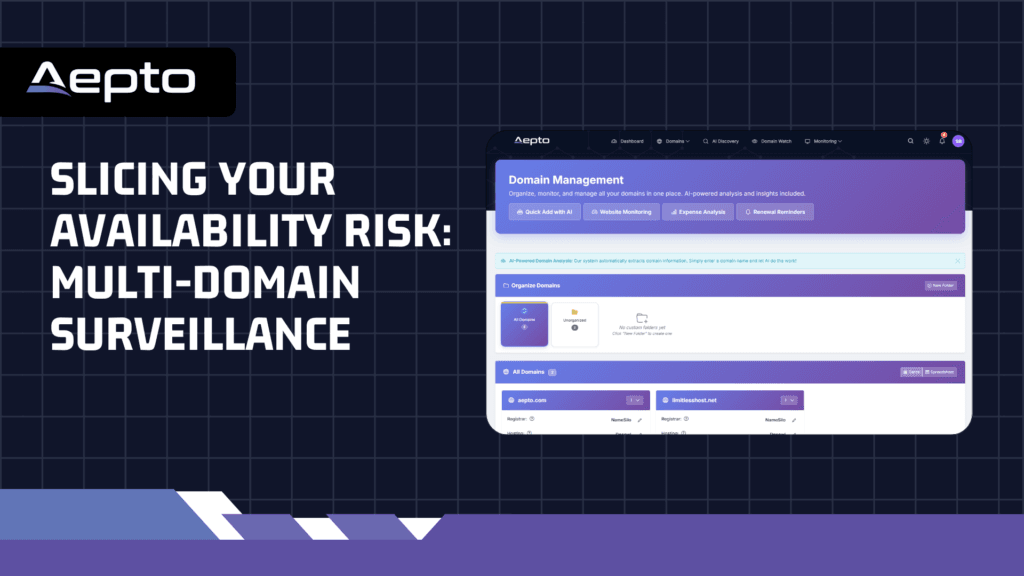
By integrating your systems with the art to simplify domain management through Aepto’s advanced dashboard, you can track nameservers, registry locks, and WHOIS expirations across all major registrars in a single command center.
While Aepto’s smart domain renewal alerts ensure your core assets never lapse, our active domain watch monitors track unauthorized registrar transfers and DNS zone shifts. This multi-layered monitoring perimeter, combined with advanced domain protection and theft guard features, ensures your entire digital real estate portfolio remains secure and online.
Traditional vs. Modern Uptime Monitoring
| Technical Metric | Traditional Monitoring Method | Modern Automated Uptime (Aepto) |
|---|---|---|
| Inbound Node Checks | Single server point (High false alarm risk) | Geographically distributed multi-nodes |
| Verification Logic | Basic HTTP Header check (Status Code only) | Deep content matching, keyword & metadata checks |
| Performance Tracking | Binary “Up/Down” status | High-precision response time & latency metrics |
| SSL & Port Audits | Blind to certificate changes & TCP handshakes | Active port monitoring & automated SSL reminders |
| Alert Delivery | Slow, passive emails to single inboxes | Real-time Webhooks, Slack, Teams, SMS, and Webhooks |
| Workspace Synergy | Siloed IT tools and fragmented consoles | Centralized dashboard integrated with domain data |
Steps to Deploy a Modern Uptime Strategy
To secure your digital business with a proactive, multi-layered monitoring perimeter today, execute this three-step blueprint:
Step 1: Map Your Core Critical Paths
Log into your tracking dashboard and define your high-priority paths. Do not simply monitor your home URL; set up distinct checks for critical transaction APIs, user authentication pages, and key marketing funnels.
Step 2: Set Precise Alert Intervals
Configure smart alert cadences. Set up 1-minute check intervals for high-stakes e-commerce checkouts, and 5-to-15-minute intervals for secondary content blogs. Adjust custom alert delay windows to prevent temporary internet hiccups from triggering false-alarm cycles.
Step 3: Connect Active Team Webhooks
Link your automated monitors to your active chat apps. Set up custom endpoints to direct specific warnings to dedicated developers, ensuring your engineers are notified of server-side glitches within seconds.
Conclusion: Take Back Control of Your Digital Performance
In the hyper-competitive digital economy, your online accessibility is the core of your brand’s reputation, authority, and financial growth. Relying on basic registrar alerts, outdated manual spreadsheets, or single-node ping checks to protect these valuable assets represents an unnecessary operational risk.
By centralizing your digital portfolio, configuring multi-regional automated checks, monitoring on-page content structures, and hosting your applications on secure hardware, you build an impenetrable perimeter around your online legacy.
Are you ready to take complete control over your digital footprint? Open your Aepto Dashboard today to configure your first global check, activate smart alert webhooks, and secure your digital assets for the future.
Frequently Asked Questions (FAQs)
1. What is the difference between latency and uptime?
Uptime is a binary metric representing whether your website or server is physically reachable and responding to request queries. Latency (or response speed) is the measurement of time in milliseconds that it takes for your web server to process and deliver data back to the user’s browser, directly dictating page load speeds.
2. Can uptime monitoring help prevent search engine ranking drops?
Yes, absolutely. Search engines like Google continuously crawl websites to index their content. If their crawlers hit dead pages or server timeout errors over several days, search algorithms will rapidly de-index your site, destroying your organic traffic. Real-time monitoring allows you to resolve outages before indexing penalties can occur.
3. How does content integrity monitoring detect website defacement?
Instead of just checking if a server is online (which returns code 200), content integrity monitoring scans the actual code on your page for specific expected text strings or keywords. If an attacker replaces your homepage with a defacement file or redirects your header scripts, the text strings vanish, and the system alerts your security team.
4. Why does multi-node validation prevent false-positive alarms?
False alarms occur when a single monitoring node encounters a temporary local networking error, falsely reporting your site is down. Geographically distributed multi-nodes ensure that before an outage alert is triggered, multiple independent servers from different regions must confirm the failure, preventing unnecessary emergency alerts.
5. Why should my uptime monitoring dashboard be compatible with all registrars?
Many companies manage domains across various providers (such as GoDaddy, Namecheap, and Route 53). Having an integrated system that supports all domain registrars allows you to monitor expiration timelines, registrar changes, and DNS records on a single, consolidated command board without the operational risks of migrating domains.
6. How does premium web hosting support my uptime strategy?
Even if your domain routing and DNS records are completely secure, your site will go offline if your web host encounters resource saturation or server crashes. Storing your site directories on a high-performance host like Limitless Hosting ensures your backend processes are stable, secure, and running on unthrottled hardware.
Read more: